
See the whole site. Then know where to look.
High resolution thermal, RGB and terrain mapping for peatland restoration, targeted ground investigation and repeat monitoring.
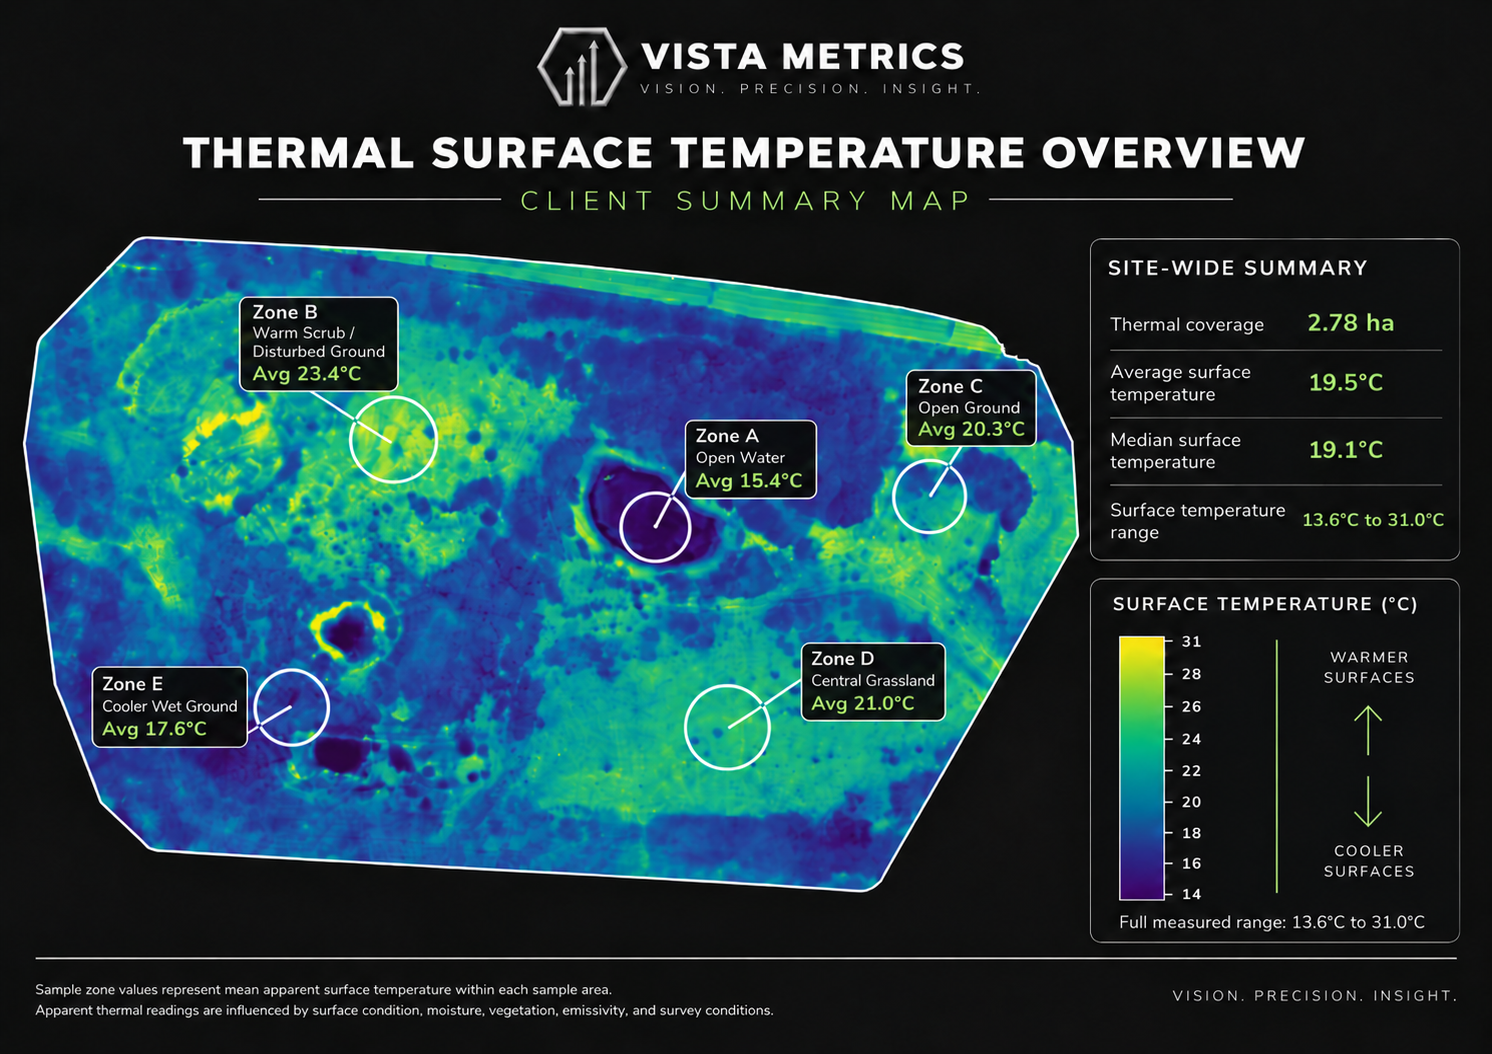
Move across the map to inspect surface temperature.
The thermal survey retains a temperature value across the mapped surface. Move the cursor over the site to inspect temperature, or click to hold a point. The web viewer uses a lightweight colour layer and embedded temperature grid rather than loading the 62 MB source TIFF.
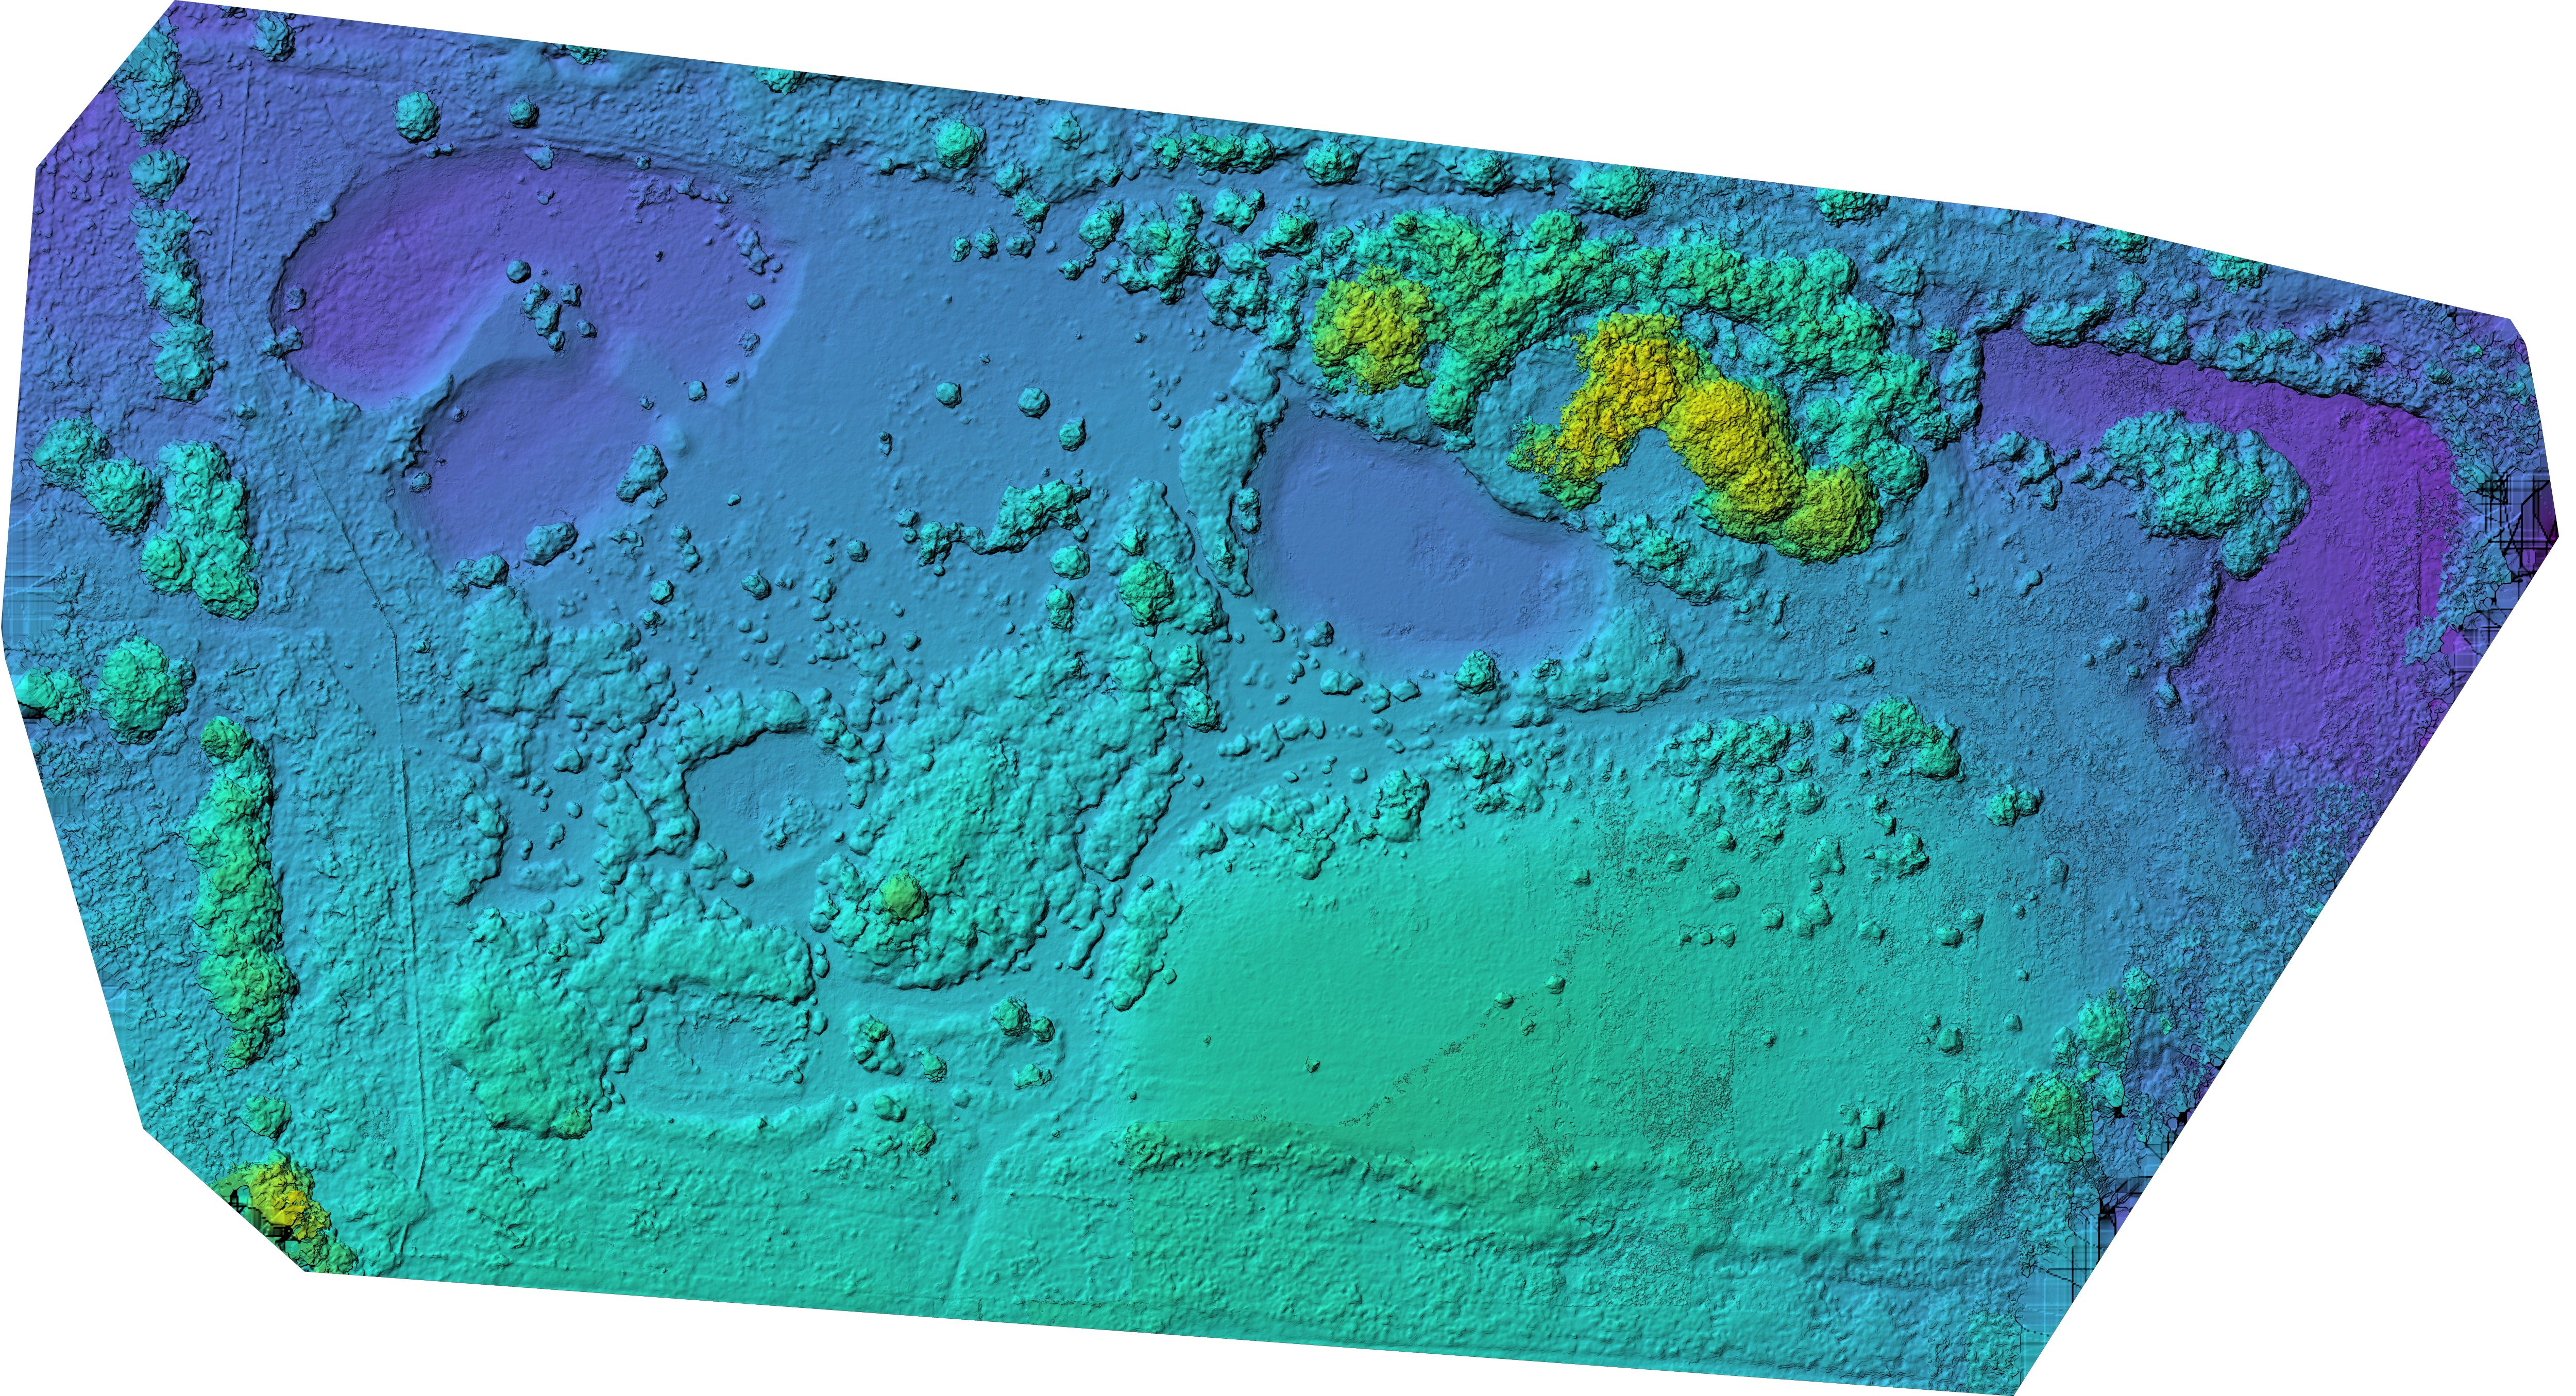
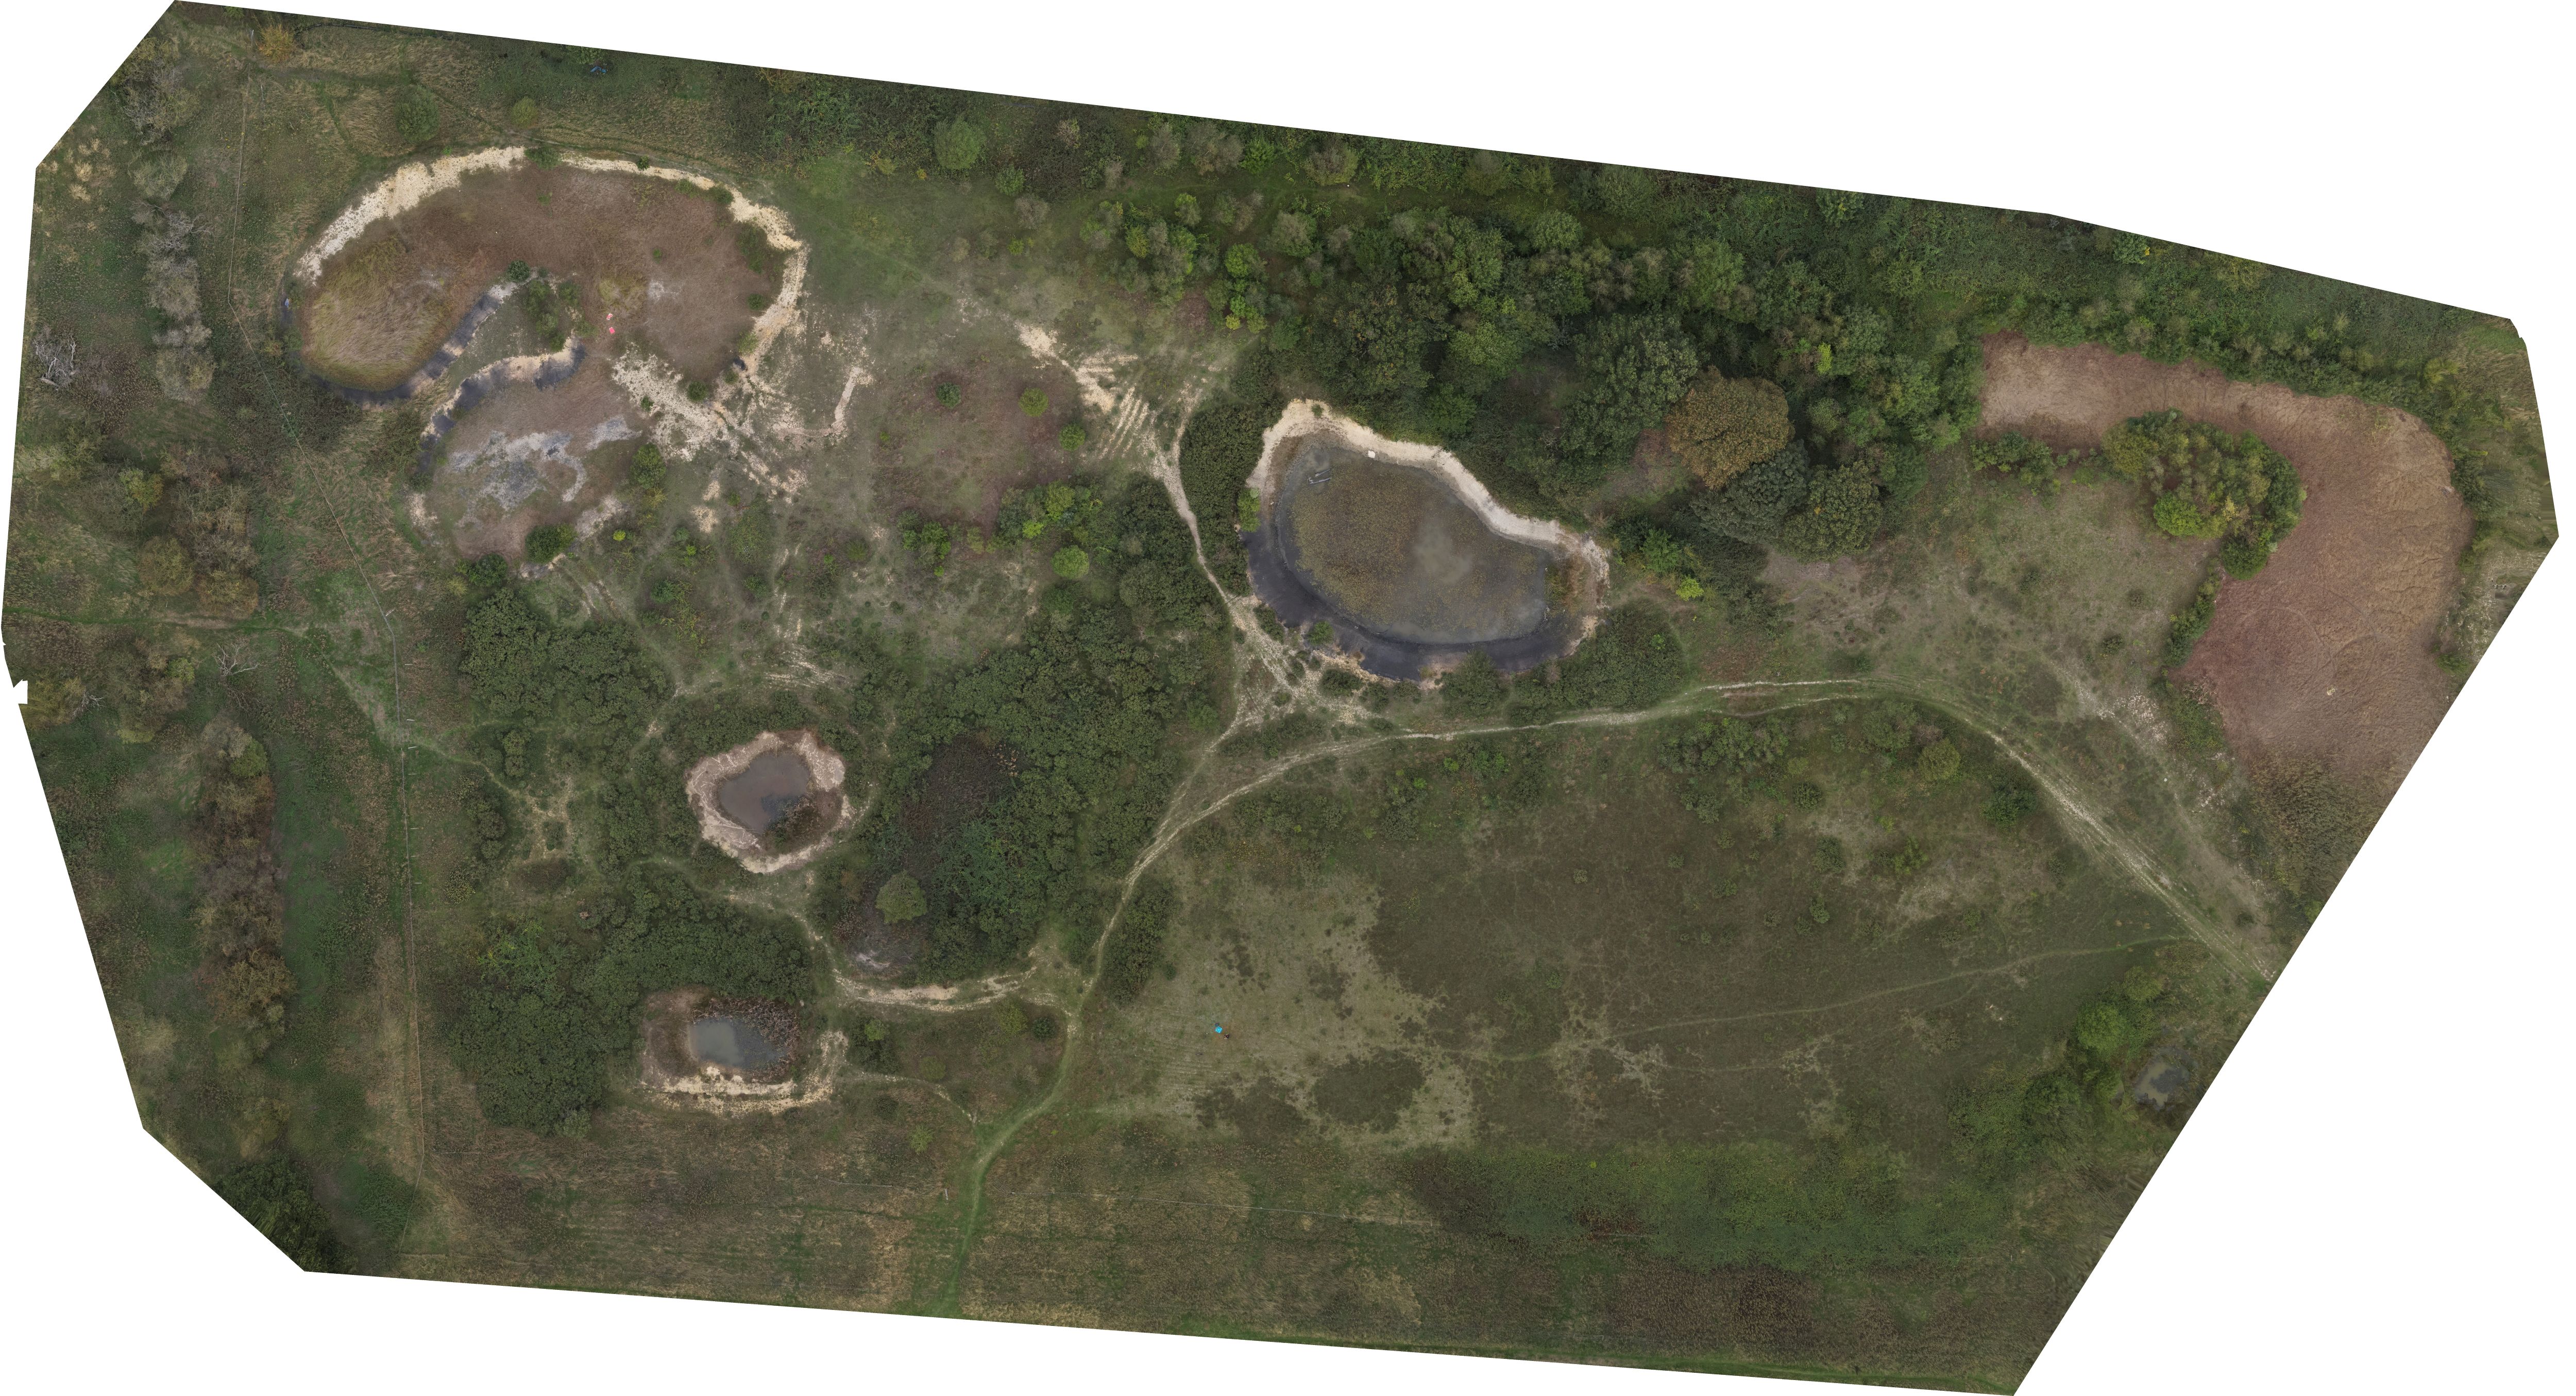
Compare the aerial survey with the surface model.
Drag the centre line, use the control underneath, or open the comparison full screen to inspect visible ground conditions alongside terrain and surface form.
RGB and terrain
Inspect surface form alongside the latest aerial imagery.
From isolated observations to site wide evidence.
Drone mapping complements field work by revealing spatial patterns across the wider landscape, helping teams decide where detailed ground investigation will be most useful.
Map conditions before intervention.
Capture thermal, RGB and terrain data before restoration works begin and retain a clear spatial baseline for future comparison.
Direct field teams to the right places.
Identify warmer, cooler or otherwise unusual areas across the site and investigate them in context on the ground.
Return and examine change spatially.
Repeat surveys in comparable conditions to examine how surface temperature patterns and visible site features change over time.
Inspect the landscape as a three dimensional model.
Rotate, zoom and inspect the reconstructed site surface to understand terrain and how visible site features relate to the wider landscape.
Not just a thermal image.
A single mapped survey can combine radiometric thermal data, RGB imagery, surface models and a navigable 3D reconstruction.
That gives project teams several ways to inspect the same landscape and creates a clear visual record that can be revisited after restoration work.
Call Vista MetricsDesigned for repeat monitoring
The strongest use case is repeat capture under comparable environmental conditions. Baseline and follow up surveys can then be compared spatially rather than relying only on isolated observations.
Interpretation stays evidence based
Surface temperature is influenced by vegetation, sunlight, wind, water, soil and local ground conditions. Thermal mapping therefore identifies patterns and priority areas rather than assigning a cause from temperature alone.
Could this help on one of your sites?
Vista Metrics provides drone based thermal, RGB, terrain and 3D mapping for baseline surveys, restoration monitoring and targeted ground investigation across the UK.